Cost analysis
By grouping or filtering data based on diverse conditions, you can view the desired cost data at a glance.
Verifying cost analysis
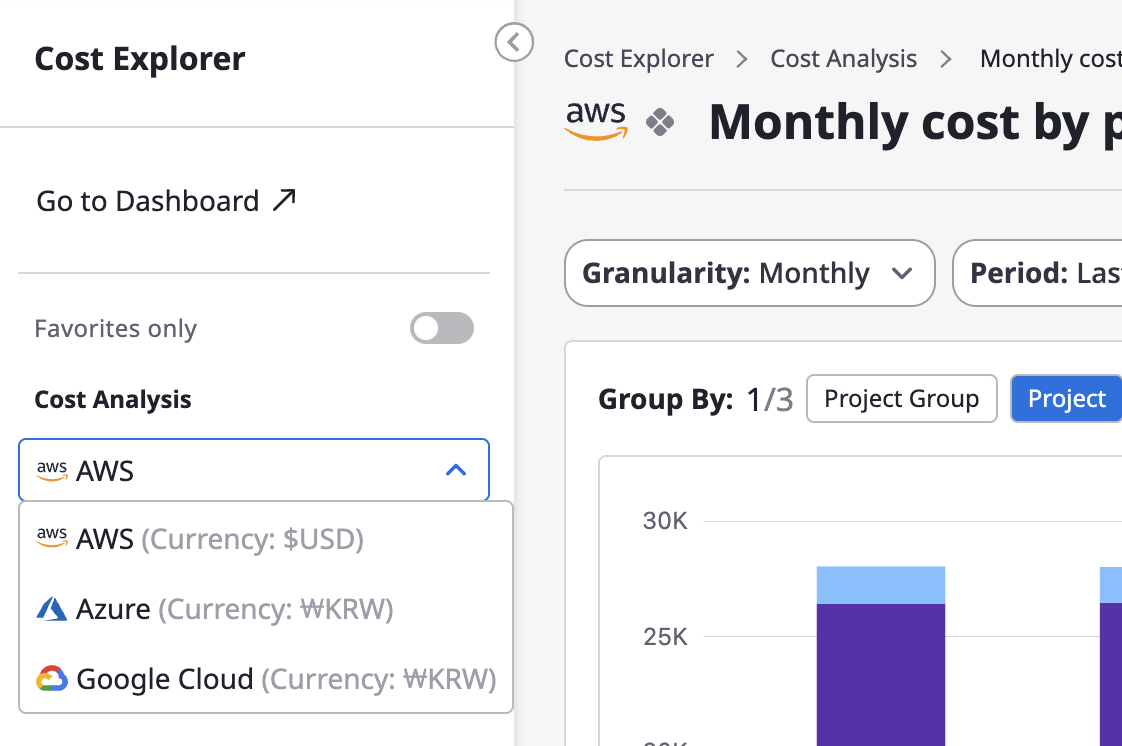
Selecting a data source
If you have more than one billing data source connected, you can perform a detailed cost analysis by selecting each data source from the "Cost Analysis" section in the left menu.
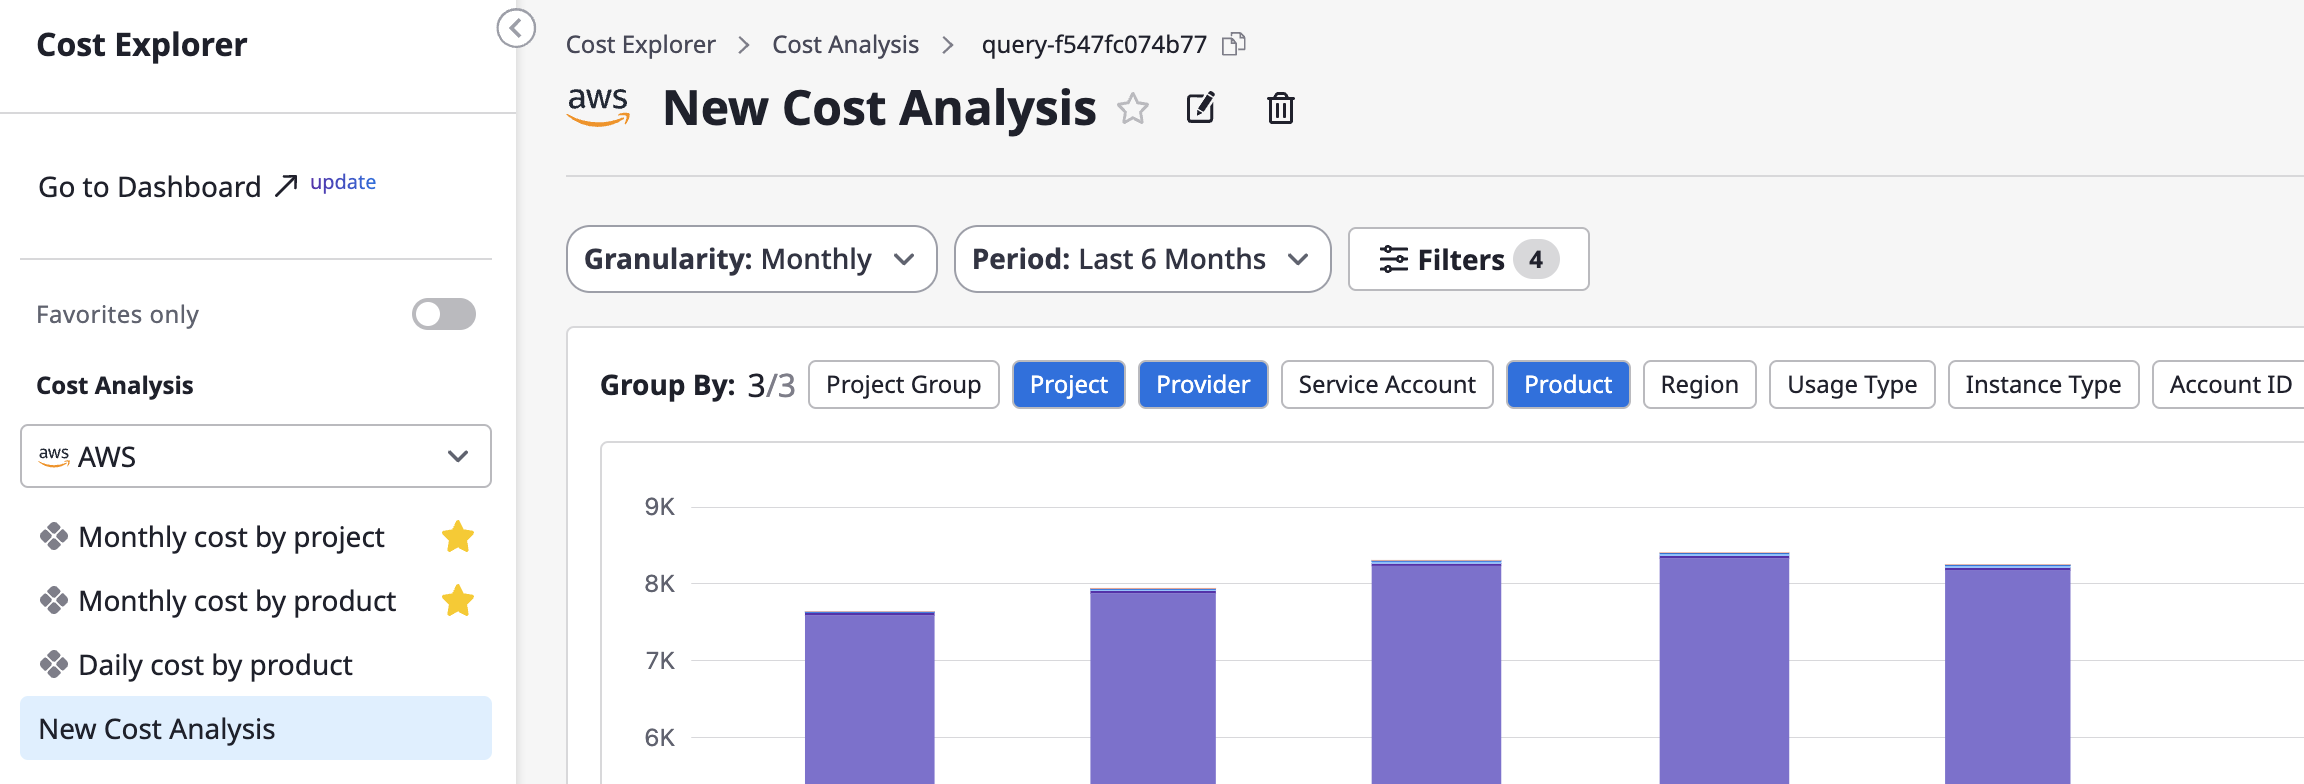
Selecting the granularity
Granularity is criteria set for how data will be displayed. The form of the provided chart or table varies depending on the detailed criteria.
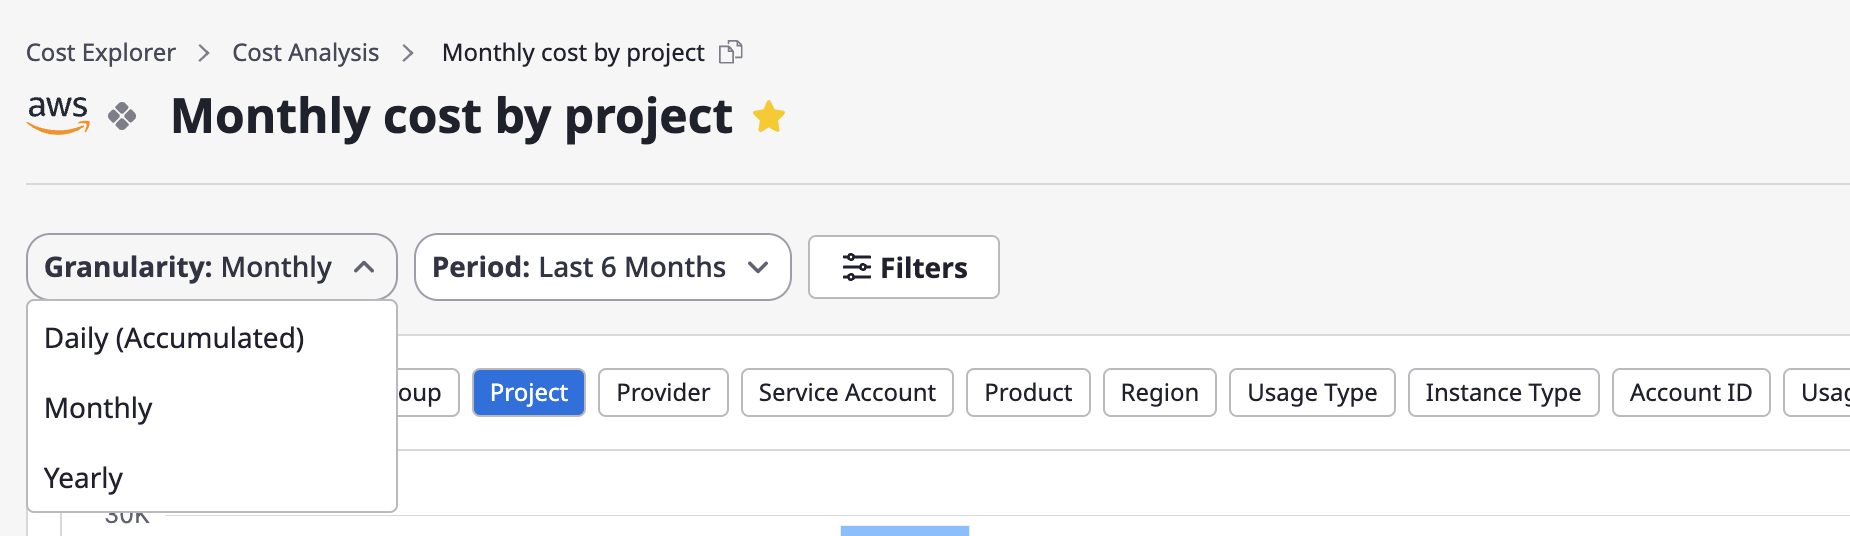
Daily: You can review daily accumulated data for a specific month.Monthly: You can check monthly data for a specific period (up to 12 months).Yearly: You can examine yearly data for the most recent three years.
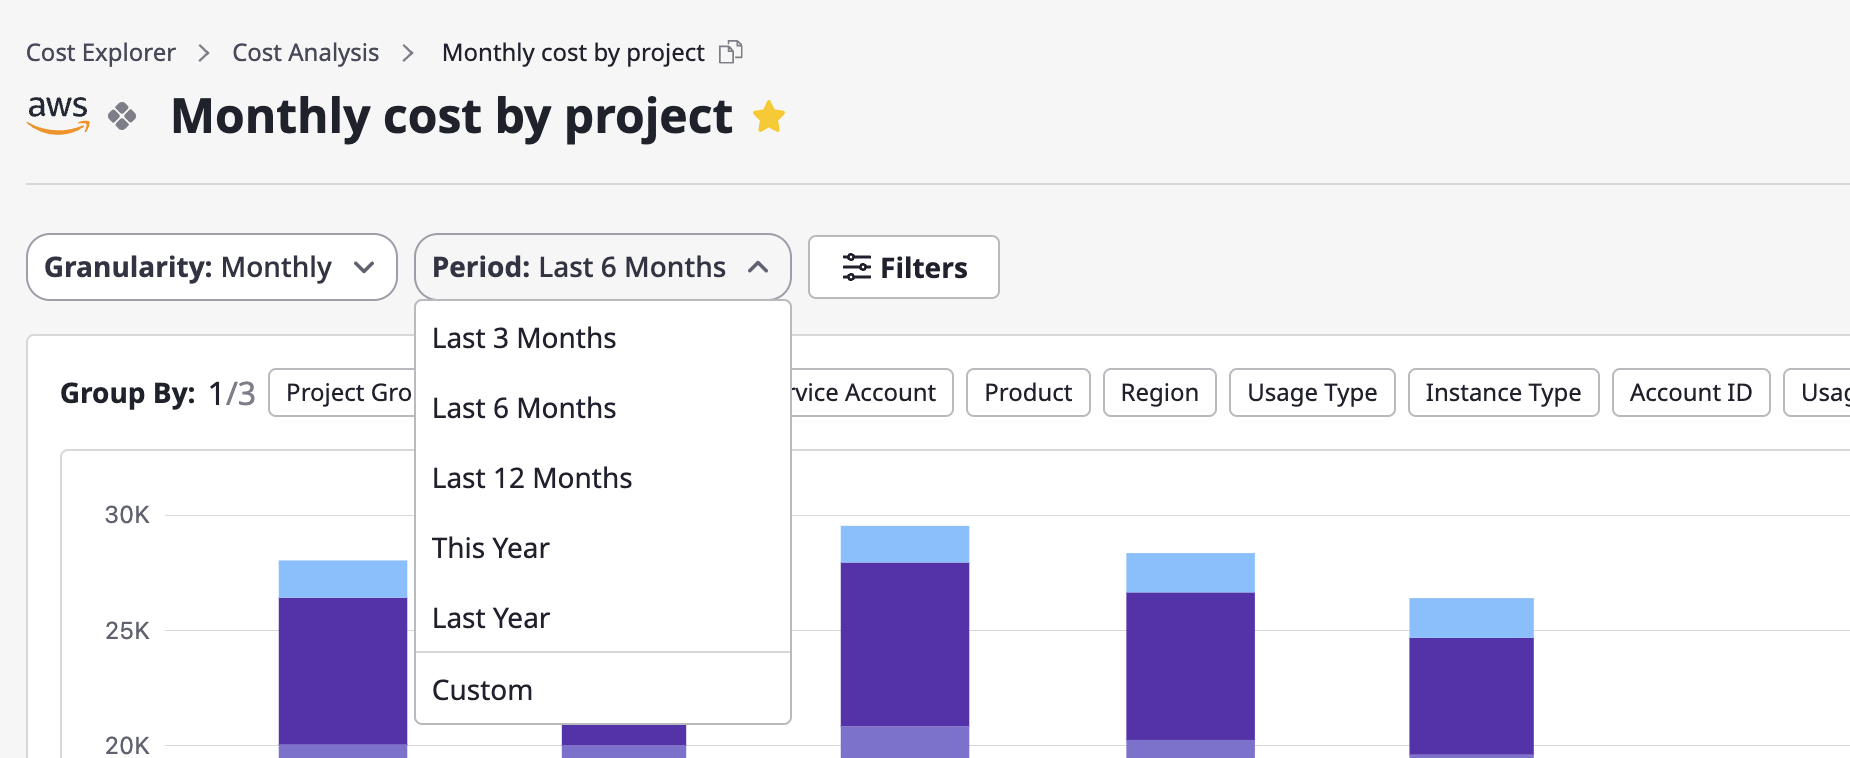
Selecting the period
The available options in the "Period" menu vary depending on a granularity you choose. You can select a menu from the [Period] dropdown or configure it directly through the "Custom" menu.
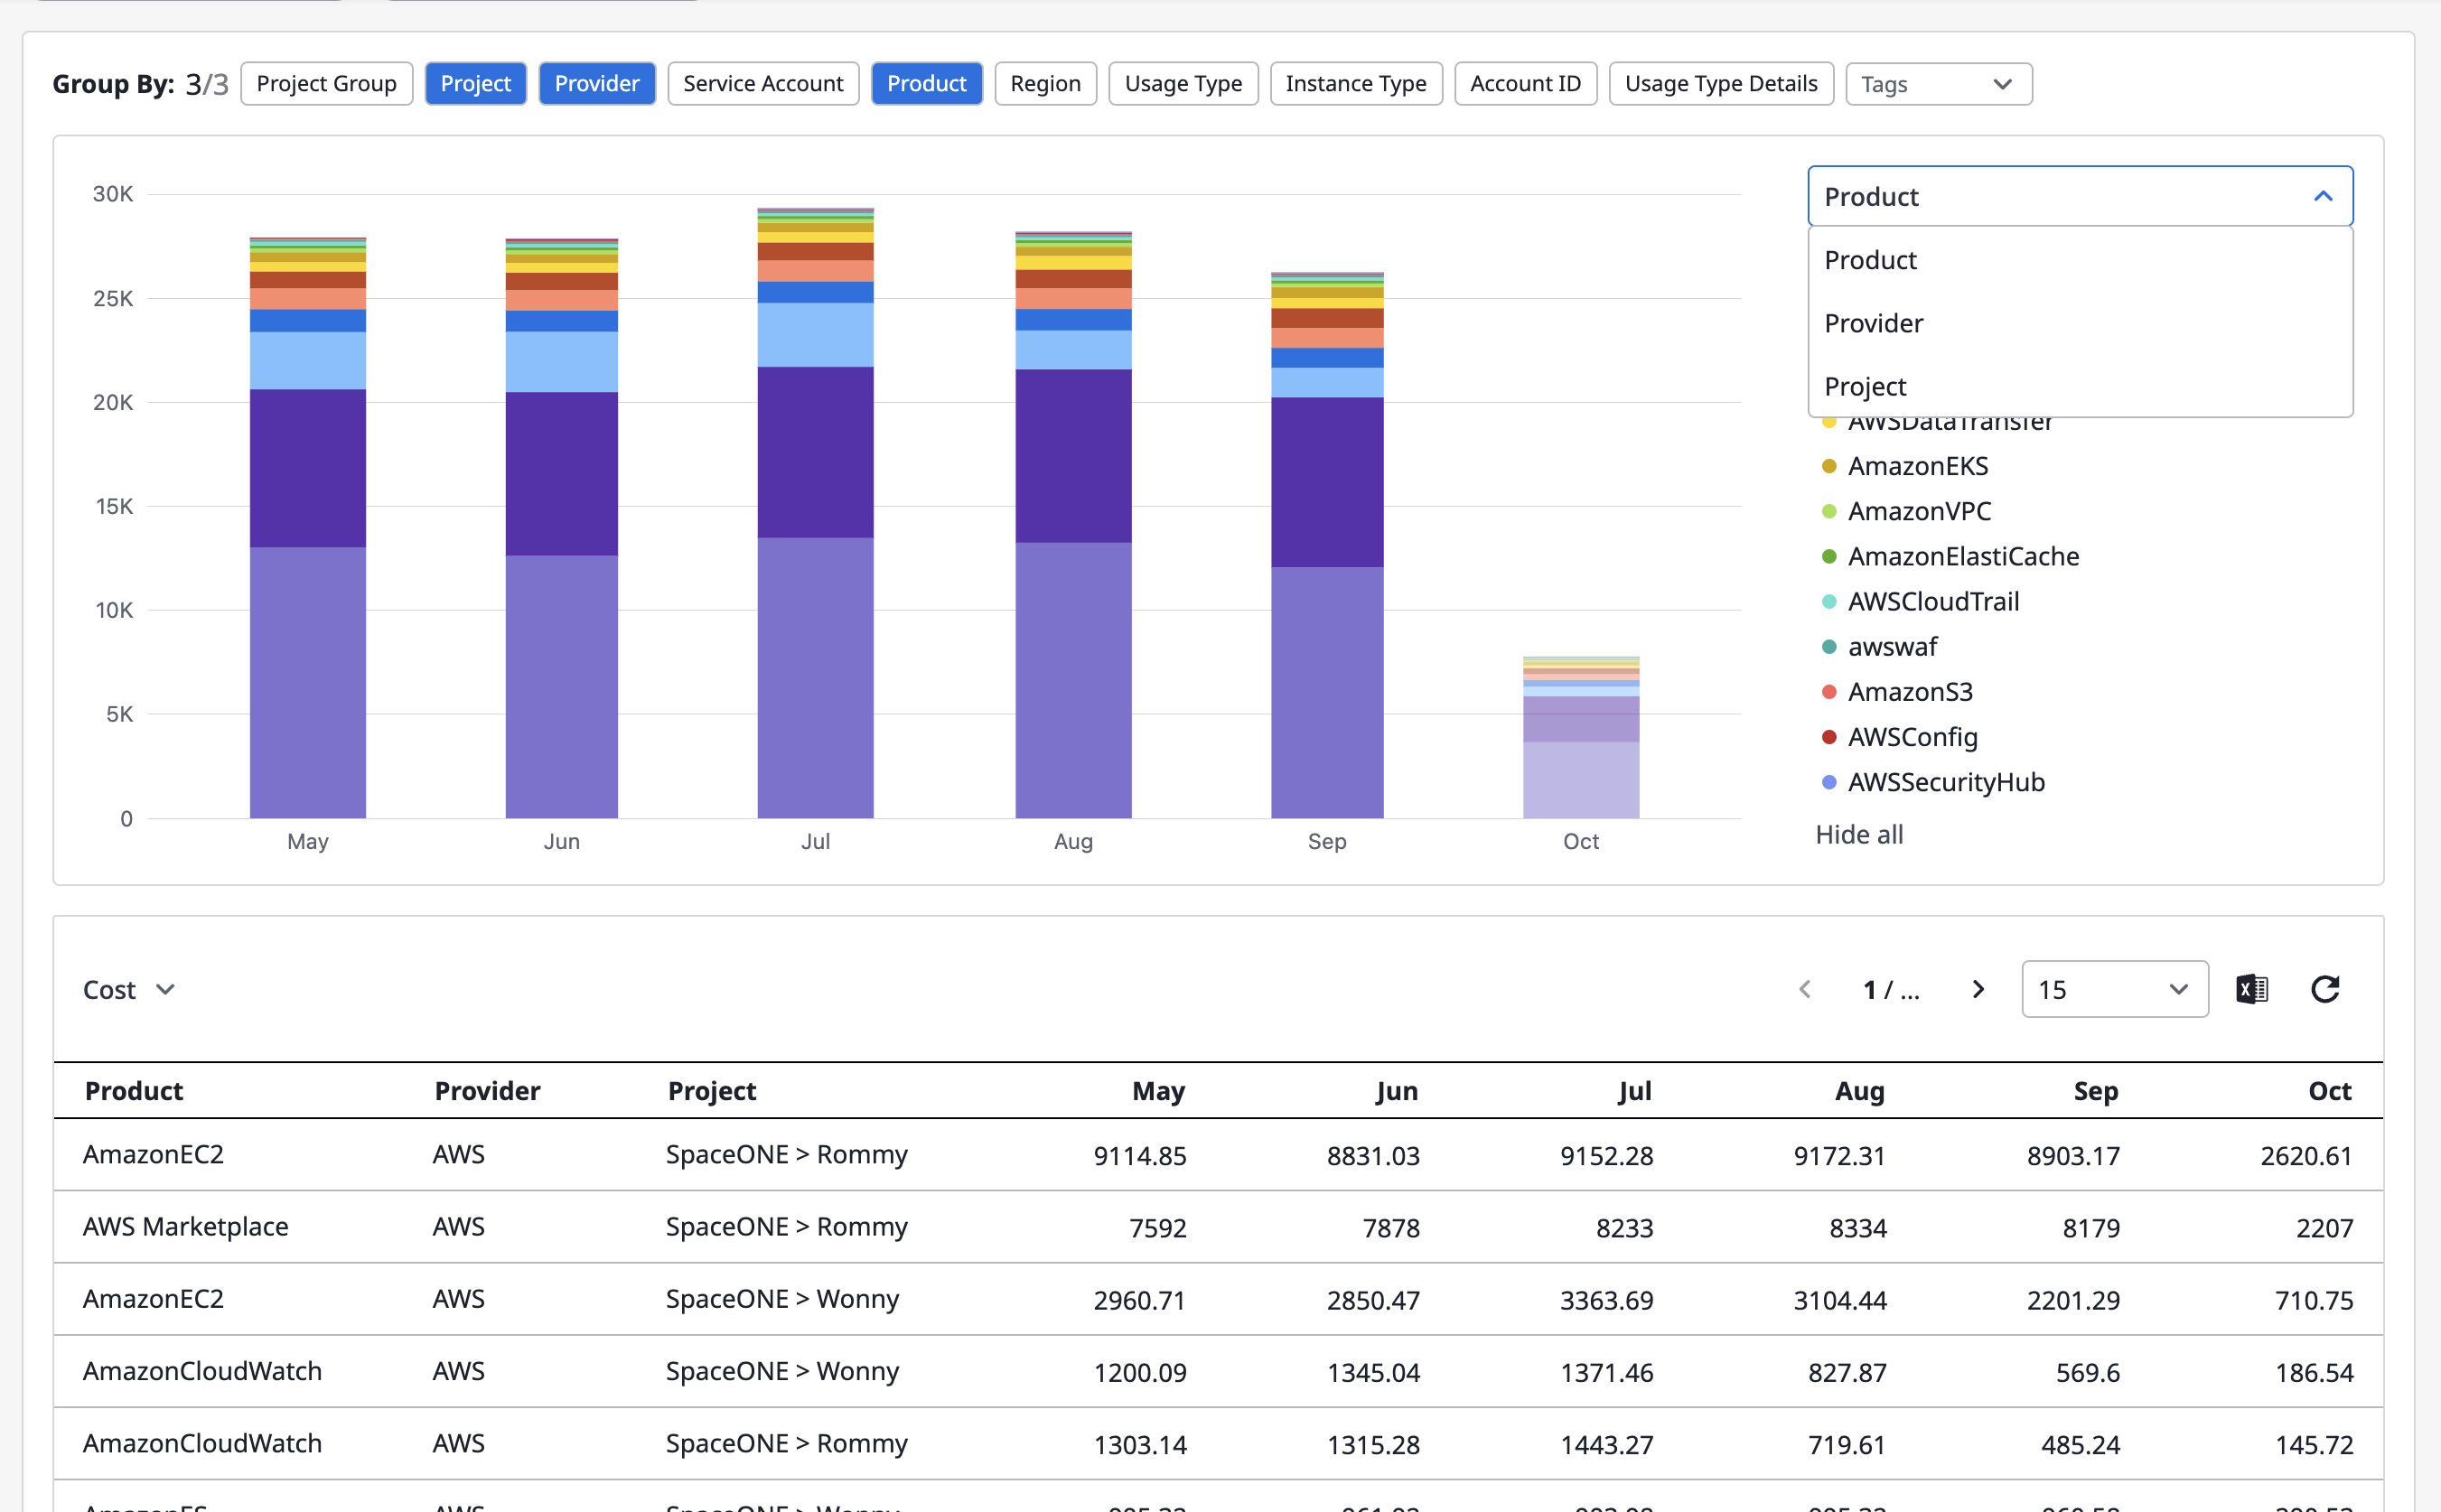
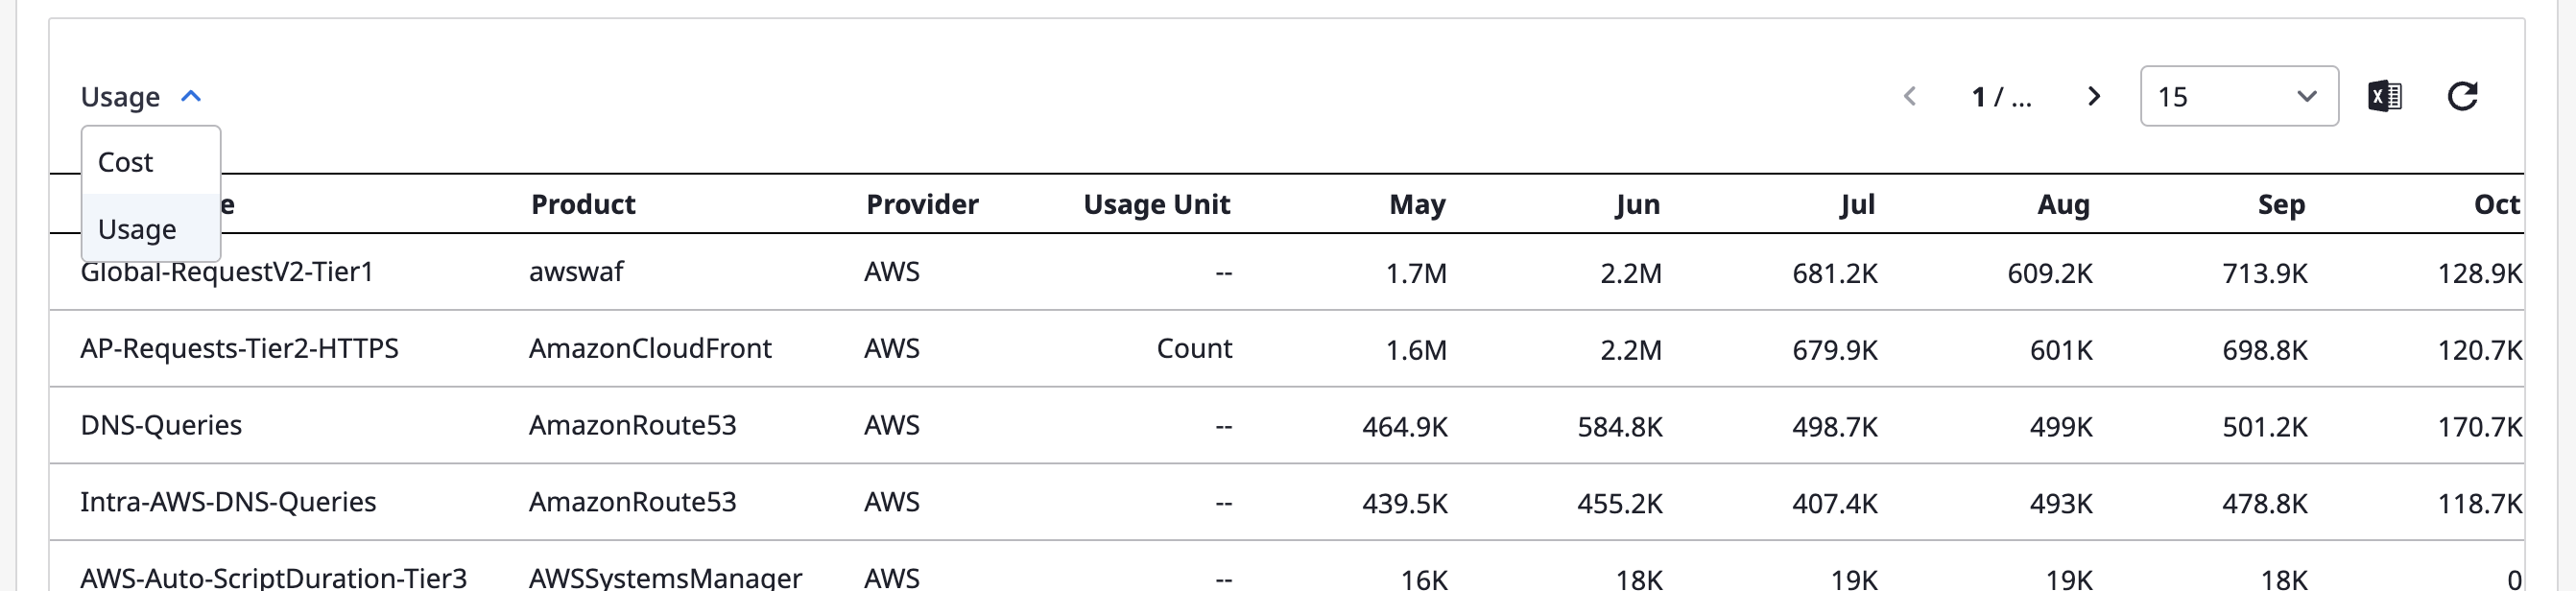
Group-by settings
You can select more than one result from group statistics. In the chart, only one selected result of group statistics is displayed, and in the table, you can see all the results from group statistics that you select.
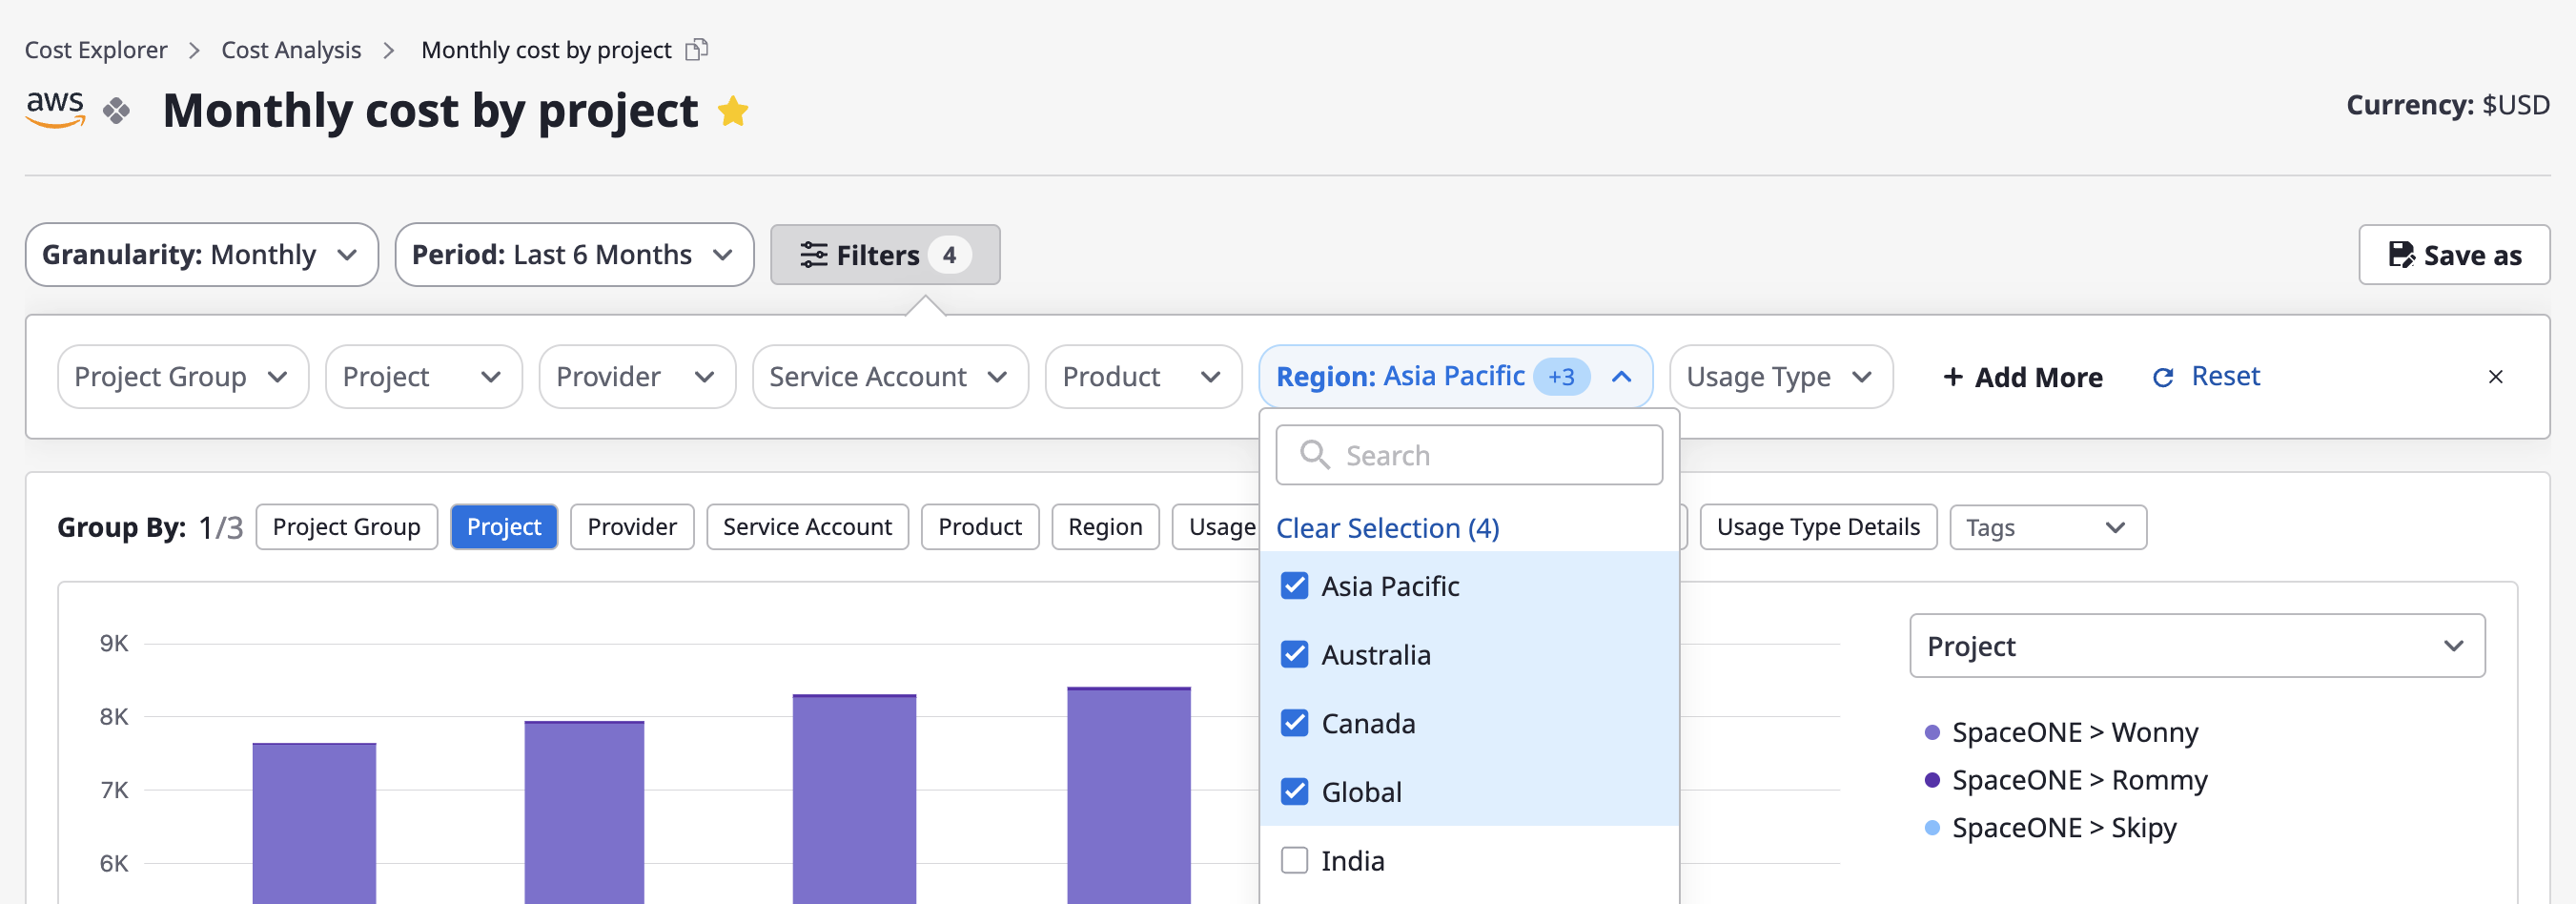
Filter settings
Filters, similar to group-by, can be selected one or more at a time, and your configured values are used for filtering with an "AND" condition.
(1) Click the [Filter] button at the top of the page.
(2) When the "Filter Settings" window opens, you can choose the desired filters, and the selections will be immediately reflected in the chart and table.
Creating/managing custom cost analysis
Creating a custom analysis page
To alleviate the inconvenience of having to reset granularity and period every time you enter the "Cost Analysis" page, a feature is provided that allows you to save frequently used settings as custom analysis pages.
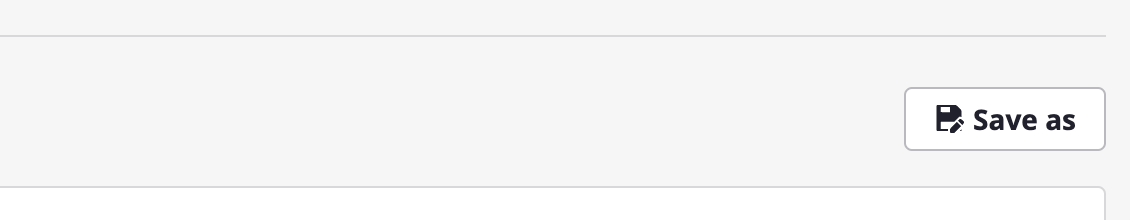
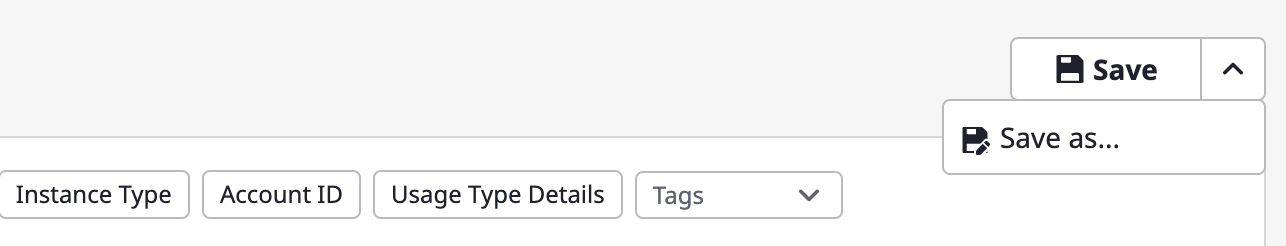
(1) Click the [Save As] button in the upper-right corner of a specific cost analysis page.
(2) After entering a name and clicking the [Confirm] button, a new analysis page is created.
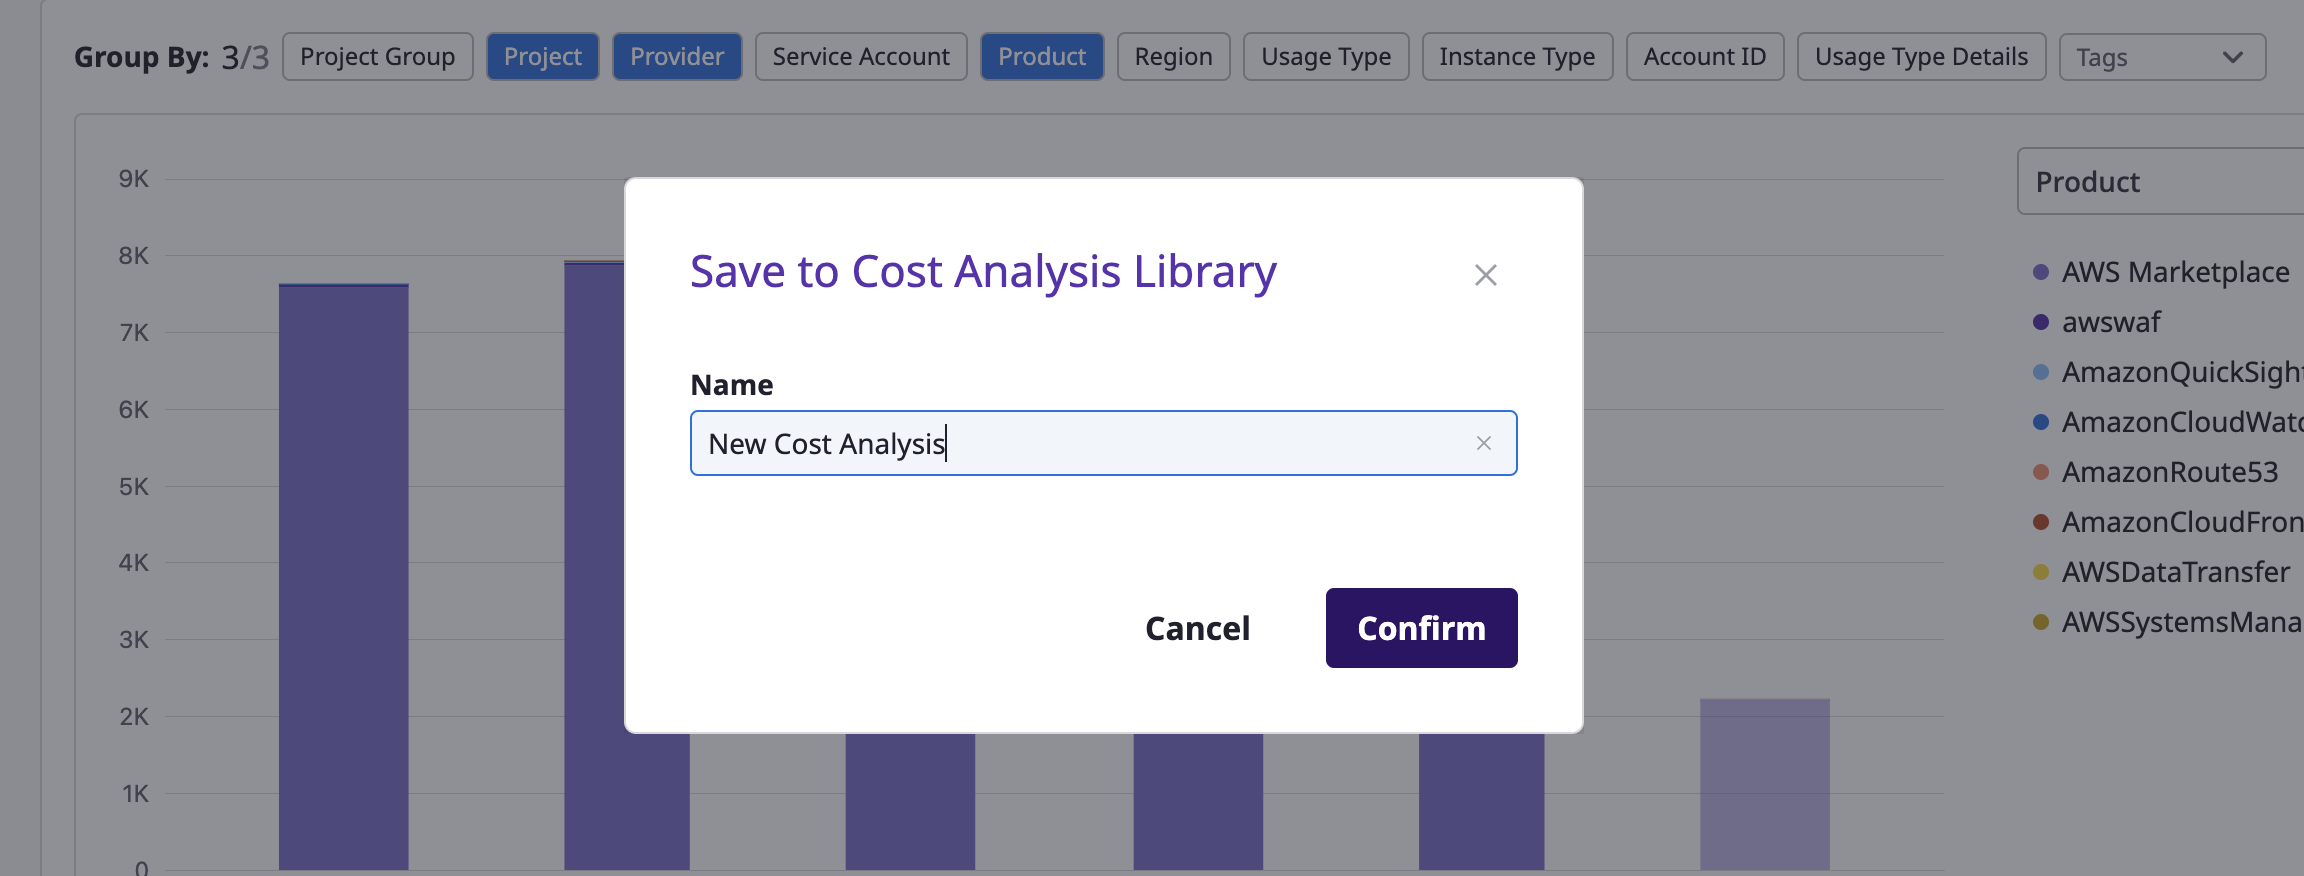
(3) Custom cost analysis pages can be saved with settings like name, filters, group-by, etc., directly using the [Save] option, and just like the default analysis pages, you can also create new pages by using [Save As].
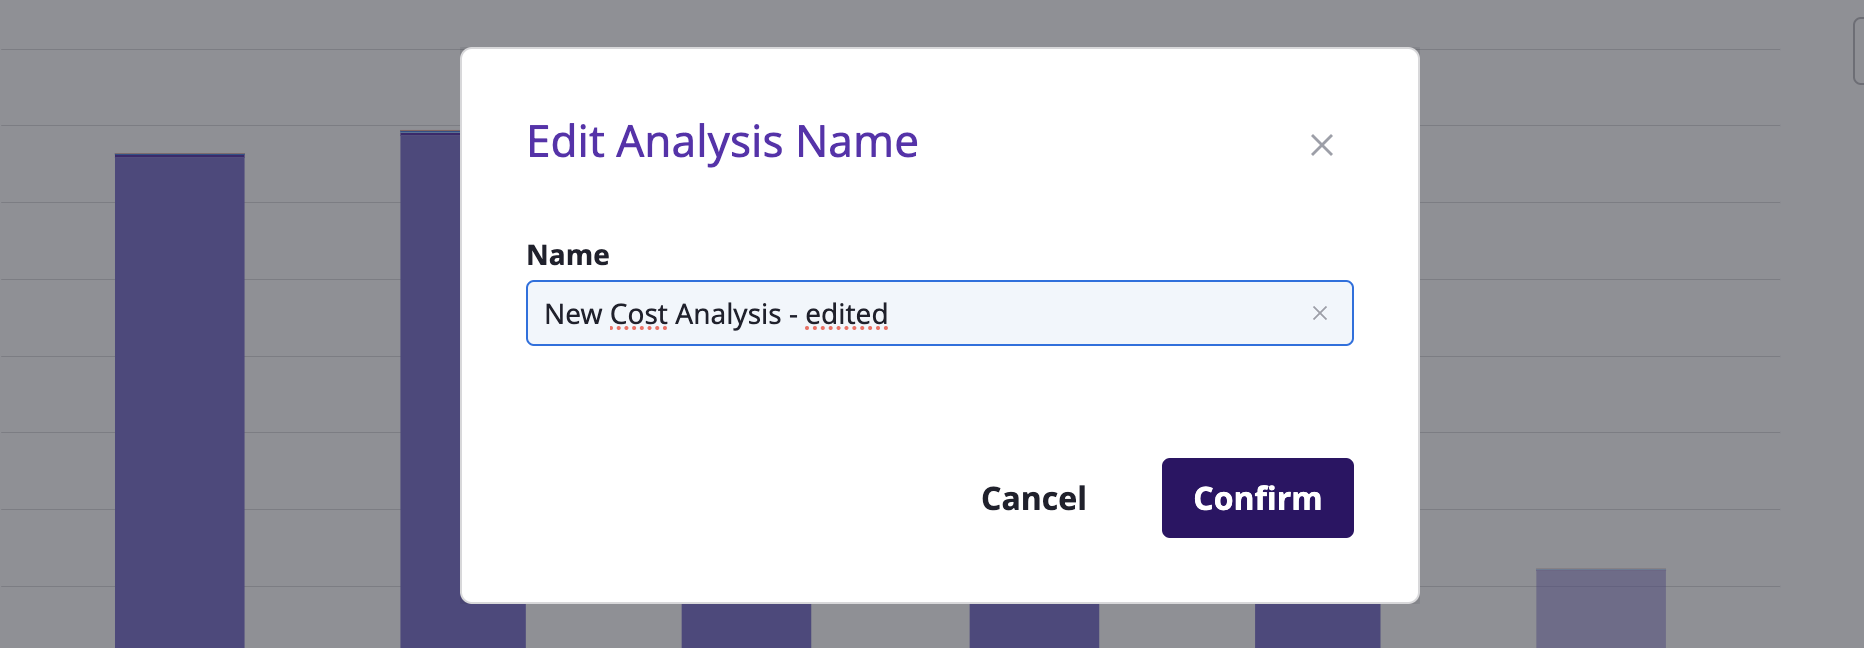
Editing the custom analysis name
You can edit the name by clicking the [Edit] button at the top of the page.

Deleting the custom analysis name
You can delete the page by clicking the [Delete] button at the top of the page.